Magnitude 5.0 earthquake shakes West Texas
The earthquake was the region’s largest in decades and the most significant in the central and eastern USA since 2016. Slip appears to have occurred on a fault well-aligned with the mapped stress field. The cause is not currently known but oil & gas operations were active in the immediate area.
NOTE: Any views expressed do not reflect those of any organization.
Citation: Lund Snee, Jens-Erik, and Dvory, Noam Z. 2020. Magnitude 5.0 earthquake shakes West Texas. jenseriklundsnee.com. https://www.jenseriklundsnee.com/blog/2020/3/27/magnitude-50-earthquake-shakes-west-texas, doi: 10.6084/m9.figshare.12045213.
Earthquakes this large are rare in the Permian Basin but have been recorded before
A M5.0 earthquake occurred on Thursday 26 March near Mentone, Texas, shaking residents as far away as Midland and El Paso. The earthquake was the largest to occur for decades in the Permian Basin region of West Texas and southeast New Mexico (Figure 1), and it was the most significant in the central and eastern USA since 2016, when three M5+ earthquakes occurred in Oklahoma. The west Texas event has been followed (at the time of writing) by five aftershocks of magnitude 3 and larger.

Figure 1. The recent M5.0 earthquake occurred near a dense trend of recent, mostly small-magnitude events (colored red) in the southern and central Delaware Basin, a subregion of the Permian Basin in west Texas and southeast New Mexico. Earthquakes are from the USGS (ANSS ComCat), TexNet, and Doser et al. (1991, 1992). NWS—Northwest Shelf; DB—Delaware Basin; CBP—Central Basin Platform; MB—Midland Basin.
The Permian Basin is no stranger to both natural and human-triggered earthquakes. In 1995, a M5.7 occurred on the southwest edge of the basin, about 100 miles southeast of Thursday’s event, and a M4.8 took place in 1975 only 20 miles south of the recent M5.0. Several clusters of earthquakes that were concentrated mostly on the Central Basin Platform (in the center of the basin) between the 1960s and 1990s are suspected to have been triggered by oil & gas production and associated fluid injection.

Figure 2. The area near Thursday’s M5.0 earthquake was quiet until late last year, when a cluster of small (M < 2) events formed (one M0.9 event occurred in May 2019). Earthquake magnitudes increased early this year leading up to the MW5.0 mainshock. The earthquake catalog shown here is from TexNet, which reported a lower ML4.6 for the mainshock.
Beginning around 2009, the rate of earthquakes increased sharply further west in the Delaware Basin, with clusters of relatively small (mostly M < 4.0) events occurring throughout Reeves and Pecos Counties. As shown in Figure 2, the area near this week’s M5.0 was previously quiet, but a cluster of M > 1.5 events developed beginning late October last year (one M0.9 event was also detected in the same area in May). Although the increase in the Delaware Basin coincides closely with renewed development in recent years, it is curious that earthquakes have been concentrated in the southern and central Delaware Basin, despite intense development in many other areas.
The causative fault was well aligned for failure in the stress field but was previously unknown
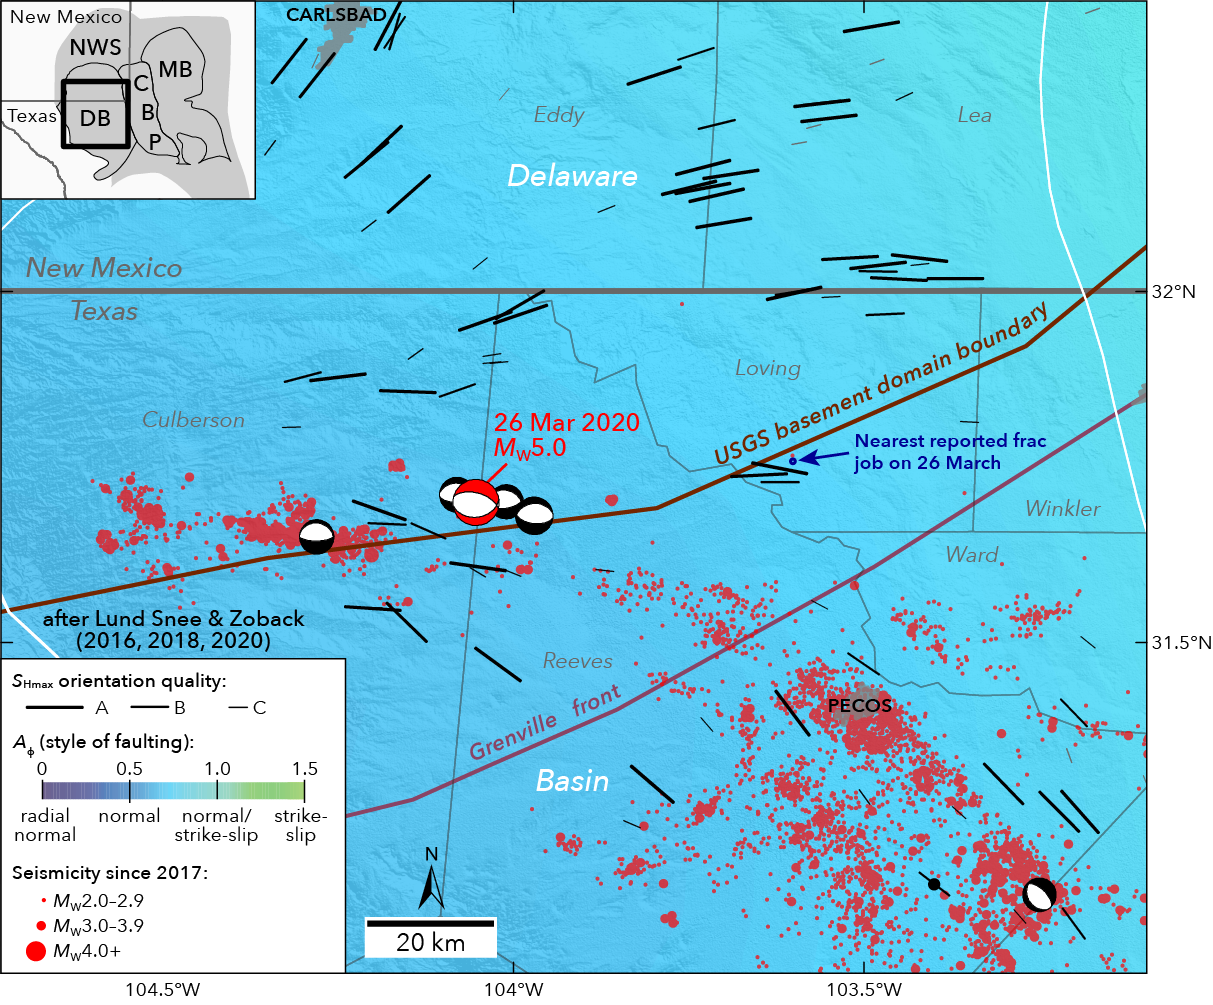
Figure 3. The earthquake occurred on a ~E–W-striking, previously unknown normal fault, consistent with stress mapping (Lund Snee & Zoback, 2016, 2018, 2020) that indicates a mostly normal faulting stress field with maximum horizontal principal stress (SHmax) oriented ~E–W. Focal mechanisms are from Saint Louis University (SLU), except for the M5.0, which is from the U.S. Geological Survey (USGS). The USGS basement domain boundary is from Lund et al. (2015), and the Grenville orogenic front is from Thomas (2006).
The state of stress in the Permian Basin was recently mapped in detail by Lund Snee & Zoback (2016, GRL; 2018, The Leading Edge; 2020, Nature Communications, in press). As shown in Figure 3, the orientation of the maximum horizontal principal stress (SHmax) changes markedly across the region, with SHmax (the black lines) rotating some 150º clockwise southward across the Delaware Basin. The earthquake occurred in an area where SHmax is oriented approximately E–W and mostly normal faulting is expected (the blue color of the background).
The USGS source mechanism for the earthquake (shown as a beachball in Figure 3) indicates normal (extensional) shear on an ~E–W-striking plane, exactly the orientation of pre-existing faults expected to be active in this area. Because the fault plane was apparently well oriented for failure, if the triggering mechanism was fluid injection or withdrawal associated with industry operations, it would have required a relatively small perturbation to fail (consistent with many of the other potentially-induced earthquakes that have occurred in Texas in recent years).
The earthquake occurred on a fault that was not previously known, at least publicly. Figure 4 shows the previously mapped faults colored by their potential to fail following a small fluid pressure increase such as would occur due to wastewater disposal (Lund Snee & Zoback, 2018). The nearest faults are green, indicating low sensitivity to fluid pressure increases. Interestingly, according to the USGS Basement Domain Map (Lund et al., 2015), the earthquake occurred on a fault near (and subparallel to) the boundary between the Mazatzal and Shawnee basement domains (fundamentally different regions of the Earth’s crust that collided and were adhered together some 1.4 billion years ago). It is possible that the M5.0 and the preceding earthquakes occurred along significant (but unmapped) faults associated with this collisional boundary.

Figure 4. Locations of injection and disposal wells (from Enverus DrillingInfo), colored by the distance between their permitted bottom-hole depth and the top of the crystalline basement (colored background, mapped by the Texas Bureau of Economic Geology). Only active and permitted wells are shown. Faults are colored by their slip potential (from Lund Snee has & Zoback, 2018). Faults were compiled from Ewing et al. (1990), Green and Jones (1997), Ruppel et al. (2005), and the USGS Quaternary Faults and Folds Database (Crone and Wheeler, 2000). Also shown are recent earthquakes from the TexNet seismic catalog (black circles) and active drill rigs (black triangles) from DrillingInfo. The USGS basement domain boundary is from Lund et al. (2015). The nearest frac job reported to FracFocus on 26 March 2020 was more than 40 km to the east, likely much too far away to have triggered the event.
The event occurred near active oil & gas industry operations but its cause is not yet established
The Permian Basin is the most important unconventional oil-producing region in the United States, with some 400 drill rigs in operation as of early March, many of which are concentrated in the Delaware Basin subregion. As shown in Figure 4, at the time of the M5.0, one rig was active in the immediate area and 2–3 other rigs were active nearby.
Despite the nearby industry activity, the closest hydraulic fracturing operation reported to FracFocus was more than 40 km away, likely much too distant to have played a role (although it is possible that other frac’ing operations occurred nearby but were not reported). However, two wastewater disposal wells and one injection (potentially enhanced oil recovery) well are active in the immediate area, according to the Enverus DrillingInfo database.
Figure 4 shows saltwater disposal and injection wells in the region, colored by the distance between their permitted bottom-hole depths and the mapped top of the crystalline basement (below the basin sediments that are being produced for oil & gas). Because the crystalline basement can host larger faults, and larger faults can host larger earthquakes, injection of fluid into wells that penetrate near (or into) the crystalline basement can be especially concerning for earthquake hazards. However, in the case of the recent M5.0, which occurred at an estimated depth of 6.6 km (4.1 miles), the nearby wells’ maximum permitted depths are significantly shallower than the basement (at least 5000 ft away). It is certainly possible that fluid pressure migrated down from the disposal well (or from deeper, older disposal wells) into large faults within the basement, but the distance from the well to the top-basement makes any link between the earthquake and nearby wastewater disposal somewhat less straightforward. In addition, a third wastewater disposal well near the epicenter listed as “Completed” (rather than “Active”) is permitted to disposal depths within the crystalline basement (see Figs. 4.2 and 4.3 of Lund Snee, 2020).
The cause of this event is not yet known, including whether or not it was triggered by industrial activities. The triggering mechanism and the potential for additional seismicity nearby will likely be the subject of active research for months to come.
Acknowledgements
The research by Lund Snee & Zoback was funded by the Stanford Center for Induced & Triggered Seismicity (SCITS) industrial affiliates program. Lund Snee was supported by SCITS during his Ph.D. research and Dvory is currently supported by SCITS.
References
Crone, A. J., and R. L. Wheeler, 2000, Data for Quaternary faults, liquefaction features, and possible tectonic features in the Central and Eastern United States, east of the Rocky Mountain front: U.S. Geological Survey Open-File Report 00-260, p. 332.
Doser, D. I., M. R. Baker, and D. B. Mason, 1991, Seismicity in the War-Wink gas field, Delaware Basin, west Texas, and its relationship to petroleum production: Bulletin of the Seismological Society of America, v. 81, no. 3, p. 971–986, doi:10.1016/0148-9062(92)93679-E.
Doser, D. I., M. R. Baker, M. Luo, P. Marroquin, L. Ballesteros, J. Kingwell, H. L. Diaz, and G. Kaip, 1992, The not so simple relationship between seismicity and oil production in the Permian Basin, west Texas: Pure and Applied Geophysics PAGEOPH, v. 139, no. 3–4, p. 481–506, doi:10.1007/BF00879948.
Ewing, T. E., R. T. Budnik, J. T. Ames, and D. M. Ridner, 1990, Tectonic map of Texas: Austin, TX, Bureau of Economic Geology, University of Texas at Austin.
Green, G. N., and G. E. Jones, 1997, The Digital Geologic Map of New Mexico in ARC/INFO Format: U.S. Geological Survey Open File Report, v. 97–52, p. 9.
Lund, K., S. E. Box, C. Holm-Denoma, C. A. San Juan, R. J. Blakely, R. W. Saltus, E. D. Anderson, and E. H. Dewitt, 2015, Basement Domain Map of the Conterminous United States and Alaska: U.S. Geological Survey Data Series 898, p. 41, doi:10.3133/ds898.
Lund Snee, J.-E. 2020. State of stress in North America: Seismicity, tectonics, and unconventional energy development [Ph.D. dissertation]. Stanford University, 254 p., doi:10.13140/RG.2.2.27217.07523/1.
Lund Snee, J.-E., and M. D. Zoback, 2016, State of stress in Texas: Implications for induced seismicity: Geophysical Research Letters, v. 43, no. 19, p. 10,208-10,214, doi:10.1002/2016GL070974.
Lund Snee, J.-E., and M. D. Zoback, 2018, State of stress in the Permian Basin, Texas and New Mexico: Implications for induced seismicity: Leading Edge, v. 37, no. 2, p. 127–134, doi:10.1190/tle37020127.1.
Lund Snee, J.-E., and M. D. Zoback, 2020, Multiscale variations of the crustal stress field throughout North America: Nature Communications.
Ruppel, S. C., R. H. Jones, C. L. Breton, and J. A. Kane, 2005, Preparation of maps depicting geothermal gradient and Precambrian structure in the Permian basin: USGS Order no. 04CRSA0834 and Requisition no. 04CRPR01474.
Thomas, W. A., 2006, Tectonic inheritance at a continental margin: GSA Today, v. 16, no. 2, p. 4–11, doi:10.1130/1052-5173(2006)016[4:TIAACM]2.0.CO;2.